
Mapping systems for half a dozen branches of South Dakota state government — GIS before it was easy, in service of an entire state.
Open nowBefore the first tablets were discovered and domesticated, humans on-the-go were forced to use a crude form of miniature computer – the Pocket PC. It was in that long-forgotten era that I was tasked with making a system to allow SD DOT workers to manage their inventory of highway signs and culverts. By far the longest running project from my time as a SD contract developer, I built a Windows Mobile app that let the boys on the road document the status of the highway’s inventory electronically so the data could be managed centrally and piped into their prioritization and budgeting infrastructure as repairs and replacements became necessary.
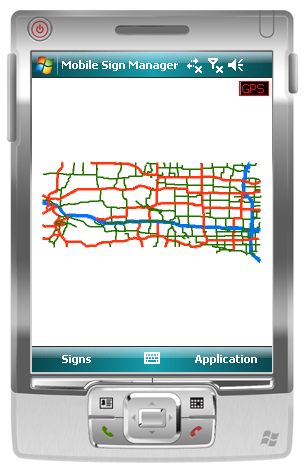
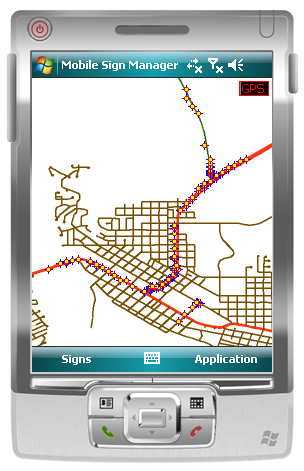
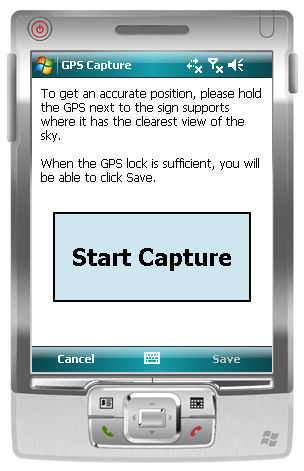
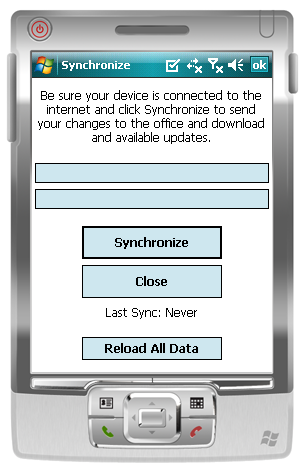
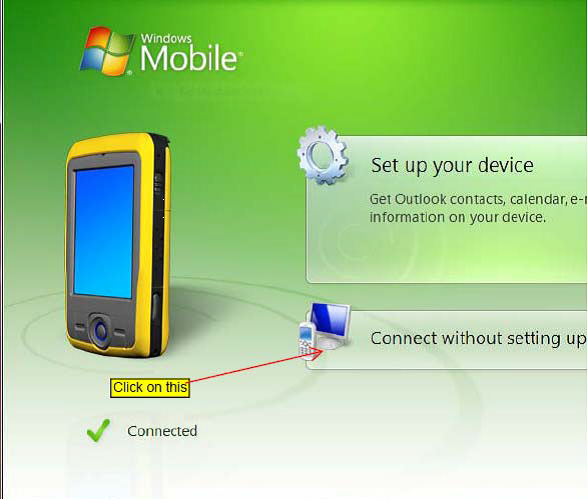
It was a truly challenging and interesting project. The first time I had to think about distributed data-authority: e.g. each Pocket PC was authoritative over the edits that were collected by its user until those edits were synchronized to the central database. I was given a reflective vest because I sometimes took to the highways to see what it felt like to use my software in the field. I treasure that vest and still wear it when I want to be easily seen at night.
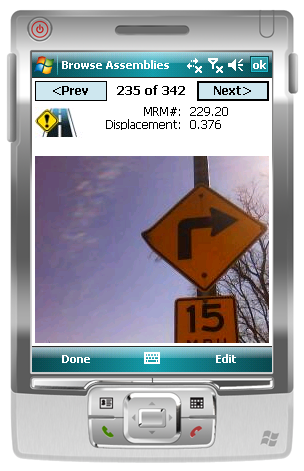
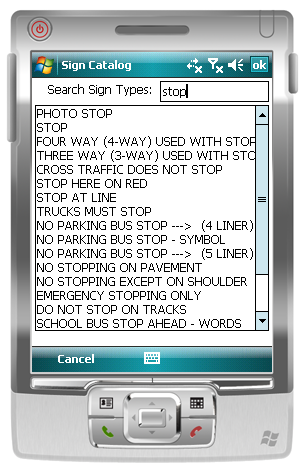
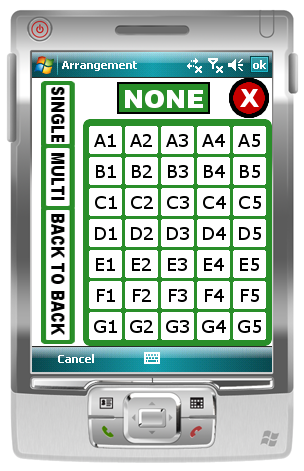
Accompanying the mobile app was a website as the central administration side of the Mobile Sign / Asset Management app. From this dashboard, the DOT staff can see all the daily updates coming in and audit the state’s culvert and sign inventory directly.
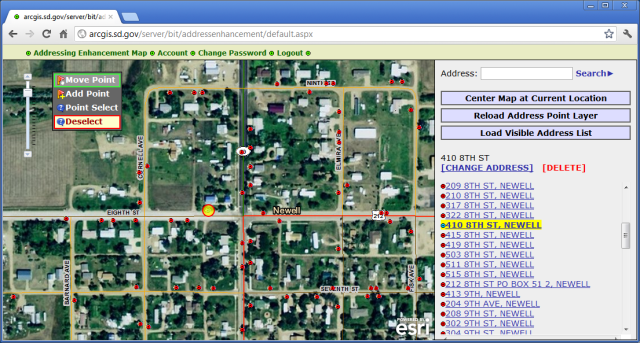
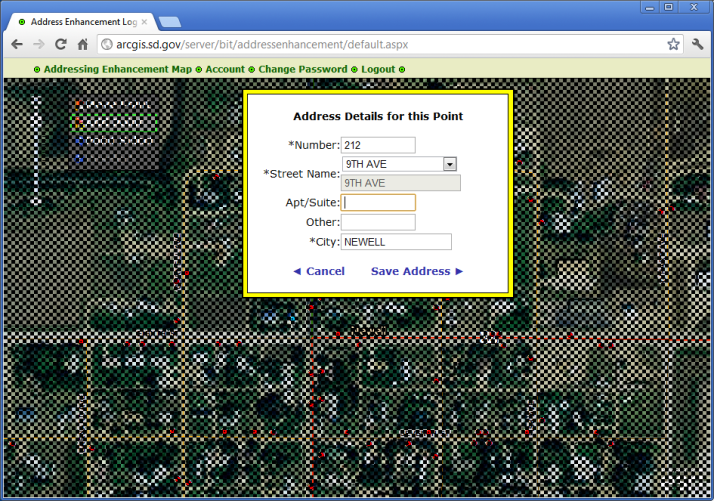
Over a three-year period, we compiled a set of points representing the rooftops that corresponded with every address in the state of South Dakota. Some counties or cities collected their addresses themselves, and we ingested their data. Some places, we sent interns to drive all the roads all summer long, reposition the points for each address to the matching rooftop, and correcting when house numbers were missing or inaccurate.
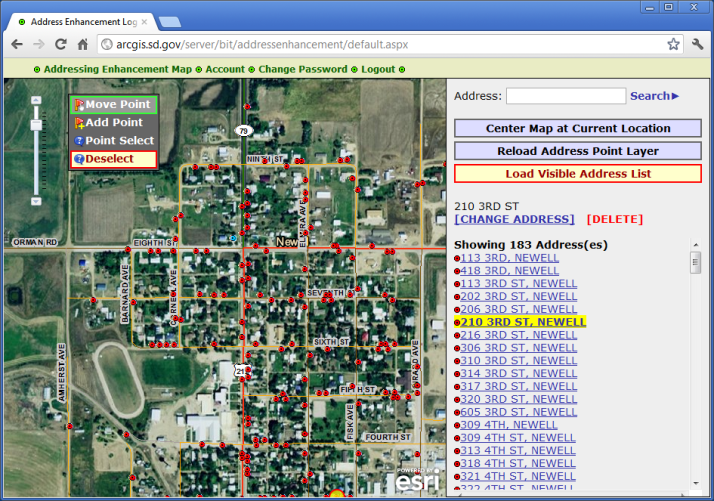
I built an iOS app that could cache the edits and synchronize them when service became available so data collection could happen in places where there was no cellular coverage. A few counties installed this app on their own devices and went out collecting data themselves, sometimes while also updating property tax related info (checking to see if Frank built a new barn, and “forgot” to tell the county treasurer about the new addition 😉). I also built a website equivalent of the iOS app, which made it easy to see the interns’ changes streaming in when they had service.
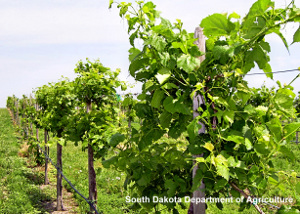
A really fun and simple project. For a licensed pesticide applicator in the state, they’re required to check this map before they spray to be especially careful that their spray doesn’t drift onto an organic farm or adversely affect nearby beehives.

A really fun example. The people that did the DOT NeedsBook were really cool and fun to work with. I got to watch/help them when they did their manual process the first year, and the second year I promised I could build them a much more automatic system that would take 95% of the pain away from the whole process. After a healthy serving of back-and-forth collaboration and refinement, we got the process down from three to six months to just a few weeks.
And later I offered to make a real-time web version of the book. DOT execs were skeptical of its usefulness at first, but within six months most of the people referencing the NeedsBook were doing it from the live website instead of the printed book.
(HY07GISUtilities, a small web helper for the NeedsBook website, served quietly alongside.)
Swarming Mountain Pine Beetles ravaged South Dakota’s woody west in the time that I lived there (early 2010’s). This website allowed affected property holders to draw the area where their trees had been destroyed, indicate the number of trees, and whether the property owner would cut them down or needed the state crews to come out.